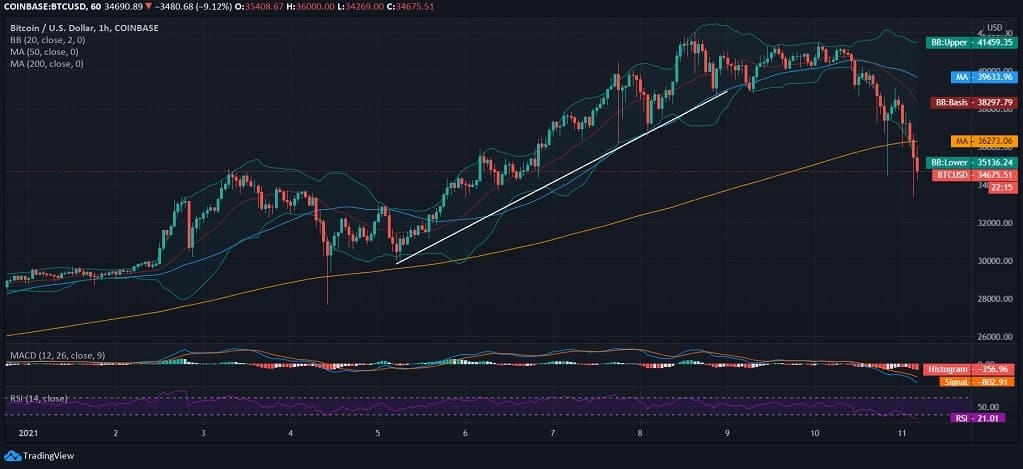
Bitcoin, the largest cryptocurrency by market capitalization, is seen plunging after hitting an All-Time High at $42k and is now dropped by over 18% since Friday’s level to the current trading price. Even though Bitcoin kept strengthening and had an “ATH season” since the last month of the previous year is now nosediving to test immediate supports. BTC lost over $35k and is now trading with no support from daily MAs.
As per the recent Bitcoin Prediction, the currency has been surrounded by many controversial future price remarks of it hitting $50,000 and $100,000 sooner than later, and with the current momentum, $50,000 may seem nothing but the next big milestone of BTC.
Unpopular Opinion – #Bitcoin will have huge upside volatility with much smaller pull backs but the days of the 30-50% blow off top are over. Simply put the institutions won't accept that. They will buy tf out of an 8% dip.
— Jason A. Williams (@GoingParabolic) January 10, 2021
The current pullback is nothing but the intraday volatility that is must, or otherwise, it may look like a complete manipulation, and the dip also serves as an entry point to trade for a further target of $50,000. The institutional investors will definitely make the most of this sheer dip of 18% in 3 days and less than 10% in one day.
BUY THE DIP!!! #BITCOIN IS ALWAYS BACK 🙌
— The Moon 🌙 (@TheMoonCarl) January 10, 2021
However, if it slips below $30k, the key support lies at $27.5k, and an apparent dip between 15-20% would do no harm to the bullish enclosures, and this time it’s the institutional buyers.
In the 2017 #Bitcoin bull market, corrections found demand after drops from 30-40%
In the current bull market demand seems to appear after corrections between 15-20%.
This is probably indicative of a difference in buyers: retail (2017) vs institutional (today). pic.twitter.com/OfRX28lEco
— Vijay Boyapati (@real_vijay) January 10, 2021
Bitcoin Price Analysis
At the press time, Bitcoin price was seen trading below $35k at $34.6k after a bearish candlewick rejection and loss of support from MA50 and MA200 at $39.6k and $36.2k, respectively. With price correction, BTC/USD is seen breaching the lower Bollinger Band on the hourly chart after the formation of red candles. However, the ATH, after an uptrend, is a clear demarcation of buyers taking over sellers that basically reversed the call after yesterday’s loss of momentum.
The MACD chart also shows a clear bearish crossover as the signal line crosses over the MACD line due to lack of active support and leading to a slash in demand, wherein the RSI is now lying at 21.01 on the hourly chart.


Leave a Reply